
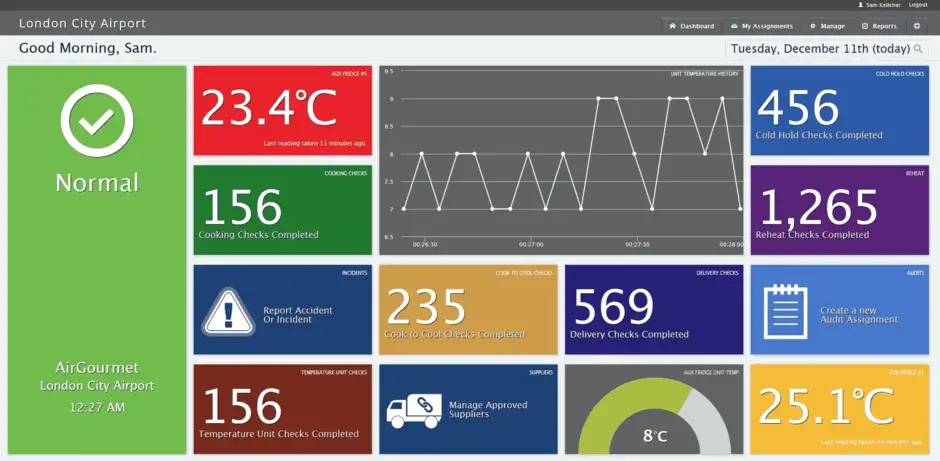
Responsive, Realtime, Customisable, Interactive Dashboard
This is a dashboard for a health and safety monitoring product I built. It has numerous unique features, and complex backends since the dashboard must effortlessly crunch potentially large datasets and summarize them in simple tabular graphs or numbers.
The backend is running within Azure on a Microsoft .NET MVC stack. The data is made available to the client application using a RESTful API (WebAPI). The front end is a single page application running Backbone + Marionette. This web app is completely static, requiring no server side rendering what-so-ever. This makes the webapp easy to package as a Chrome Packaged App and run locally, as if it were a true local native app. On first run, the authentication token (either stored as a cookie or a storage token, depending on the environment) is exchanged for profile information to display customisations to the UI, such as their own color scheme, name, home screen design.
The system is multi-tenanted, and each end user business is able to design an unlimited number of dashboards using a drag and drop interface. The dashboard provides a number of different widgets such as graphs, aggregate counters, timers, as well as more detailed list item tables. A business manager would typically put together a few different dashboard containing appropriate widgets for different roles of user within their business; then each of these users could elect to set one of these dashboard as their homepage. Or use it as a template to build their own individual personal dashboard.
Once the dashboard is loaded, it just contains a set of instructions about how the data is displayed, and what data is being queried. The next complex part of the dashboard is to then filter this dataset on the server depending on the users permissions. For example, a manager might be able to see aggregated data across all locations within their business, while a user who works just in one location might be interested in the same data, but only for their specific branch. Hence the data is filtered to prevent users from seeing more data than they are able to access; while also maintaining the ability to 'fix' the location/filter to the widget itself so it would be possible to see aggregate information for ten different locations rather than one widget showing aggregated data for all ten sites combined.
Next on top of that, the user can override the filter applied to the dashboard to show certain date ranges, location, or generally apply advanced custom filters to their dashboard. This enabled them to gain accurate report data to see how the data looked at a certain point in time, over a custom ranger, and under certain conditions. It's very powerful, and makes heavy use of WebAPIs being able to access all this data rapidly.
Adding to that, the dashboard is connected in real-time to the server using web-sockets (in this case, using SignalR to manage the web-socket connection and function as a hub). Again, this socket connection needs to be aware of the uses permissions, and the date/location filters that have been applied to the current view, and the filters fixed to the widgets themselves to relay data to the dashboard to keep it up to date. Some different widgets require the data to be in different formats. For example, a widget that counts the number of records submitted in the last hour - it doesn't need to receive the full record, just the number submitted since the last update. Likewise updates must me batched, if I send in 10,000 new records - I can't expect a dashboard to perform 10,000 updates without causing performance issues; so updates need to be collated on a regular but near realtime basis - in this case, each widget can expect to receive new data every 5 seconds. The 5 seconds was the trade of between keeping the server busy tracking updates, and people looking at the dashboard. For demo purposes, this can be reduced to 0.5 seconds to make the dashboard really real-time.
Last but not least, we have data tranforms. This is where data that originated in another language or timezone is localised to that of the viewing user. First of the widgets, and the notification text they display are all localisable into an unlimited number of languages, this includes date/time formatting and other units; such as temperature. Next data is applied by timezone. If I filter data from 10am to 4pm, the data is filtered according to the time at the location of where the data originated. Likewise, this is displayed on the detailed tables as the users current timezone where the user can hover over it to see the time local to the location, or set it to display both.
The dashboard itself uses local storage to remember the filter preferences the user has entered. As each widget is explorer based, as in, you can click on a widget to drill down and get more and more information the deeper you go. By remembering the filter preferences, when we eventually return back to the dashboard, it will re-appear as the user left it, even though the views and datasets themselves were long since destroyed.
For this particular application, the dashboard was actually only one small part of it. But this shows that even something simple as a dashboard has many moving parts and complexities, specifically dealing around with performance.
My Contributions
For this project, I designed the look and feel of the dashboard; as well as the architecture for data-storage, and notification delivery. I coded the front end views in JavaScript and wrote the WebAPIs in C#.
Technologies Used
The entire stack is run within a Azure Virtual Machine, uses Azure SQL for data storage. An Azure Queue is used to process incoming data from edge APIs. Each work unit is then processed according to business logic and a notification of the new data relayed to a notification hub, which in turn, packages the data for delivery to any relevant clients in a pubsubhub style system. I.e, the dashboard basically subscribes to the hub on certain topics that encapsulate the type of data, format, and range. The notification hub then checks to see who is in each topics notification list, and if they are eligible to receive the data, and if the data is relevant to its view. Likewise, since the APIs are RESTful, they are not maintaining any information on the clients state, so the client will automatically disregard any data that it receives that has become irrelevant if the user has since closed the view.
#Backbone #Marionette #WebAPI #.NET #Gridster